
CO₂ µmol m⁻² s⁻¹
Carbon
Whether the area is absorbing or emitting carbon, hour by hour, across the entire crop cycle.
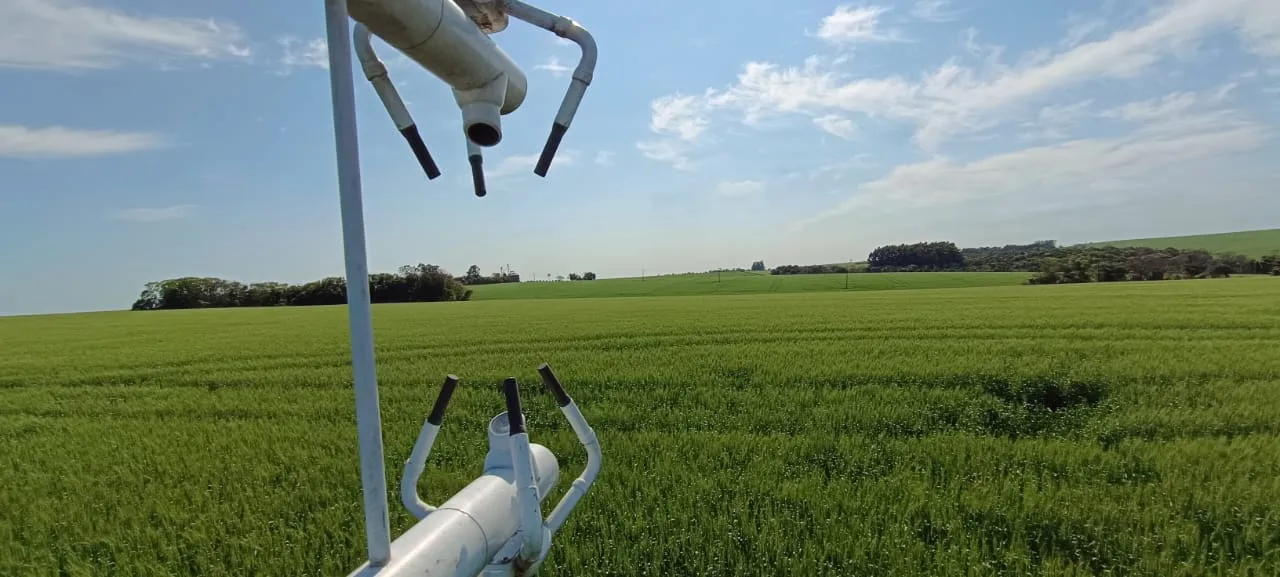
Most carbon figures used in Brazilian agriculture come from studies carried out in other countries. We install a measuring tower on your land and record the actual exchange of carbon, methane and water at high frequency, continuously, through the entire season.
What we measure
One tower measures the exchange between your land and the atmosphere above it. All four readings come from the same tower, at the same moment.
Whether the area is absorbing or emitting carbon, hour by hour, across the entire crop cycle.
The decisive gas in flooded rice and livestock, and the one where imported estimates deviate most.
The real water consumption of soil and crop combined, measured in the field rather than estimated from an equation.
How much solar energy warms the air and how much evaporates water. It also serves to verify the consistency of the measurements.
Method
The air above a field moves in turbulent vortices. Each vortex transports a parcel of air upward or downward, carrying its own gas concentration. The tower measures vertical wind speed and gas concentration at high frequency, and the relationship between the two is the flux itself. The method uses no chambers and does not interfere with the crop.
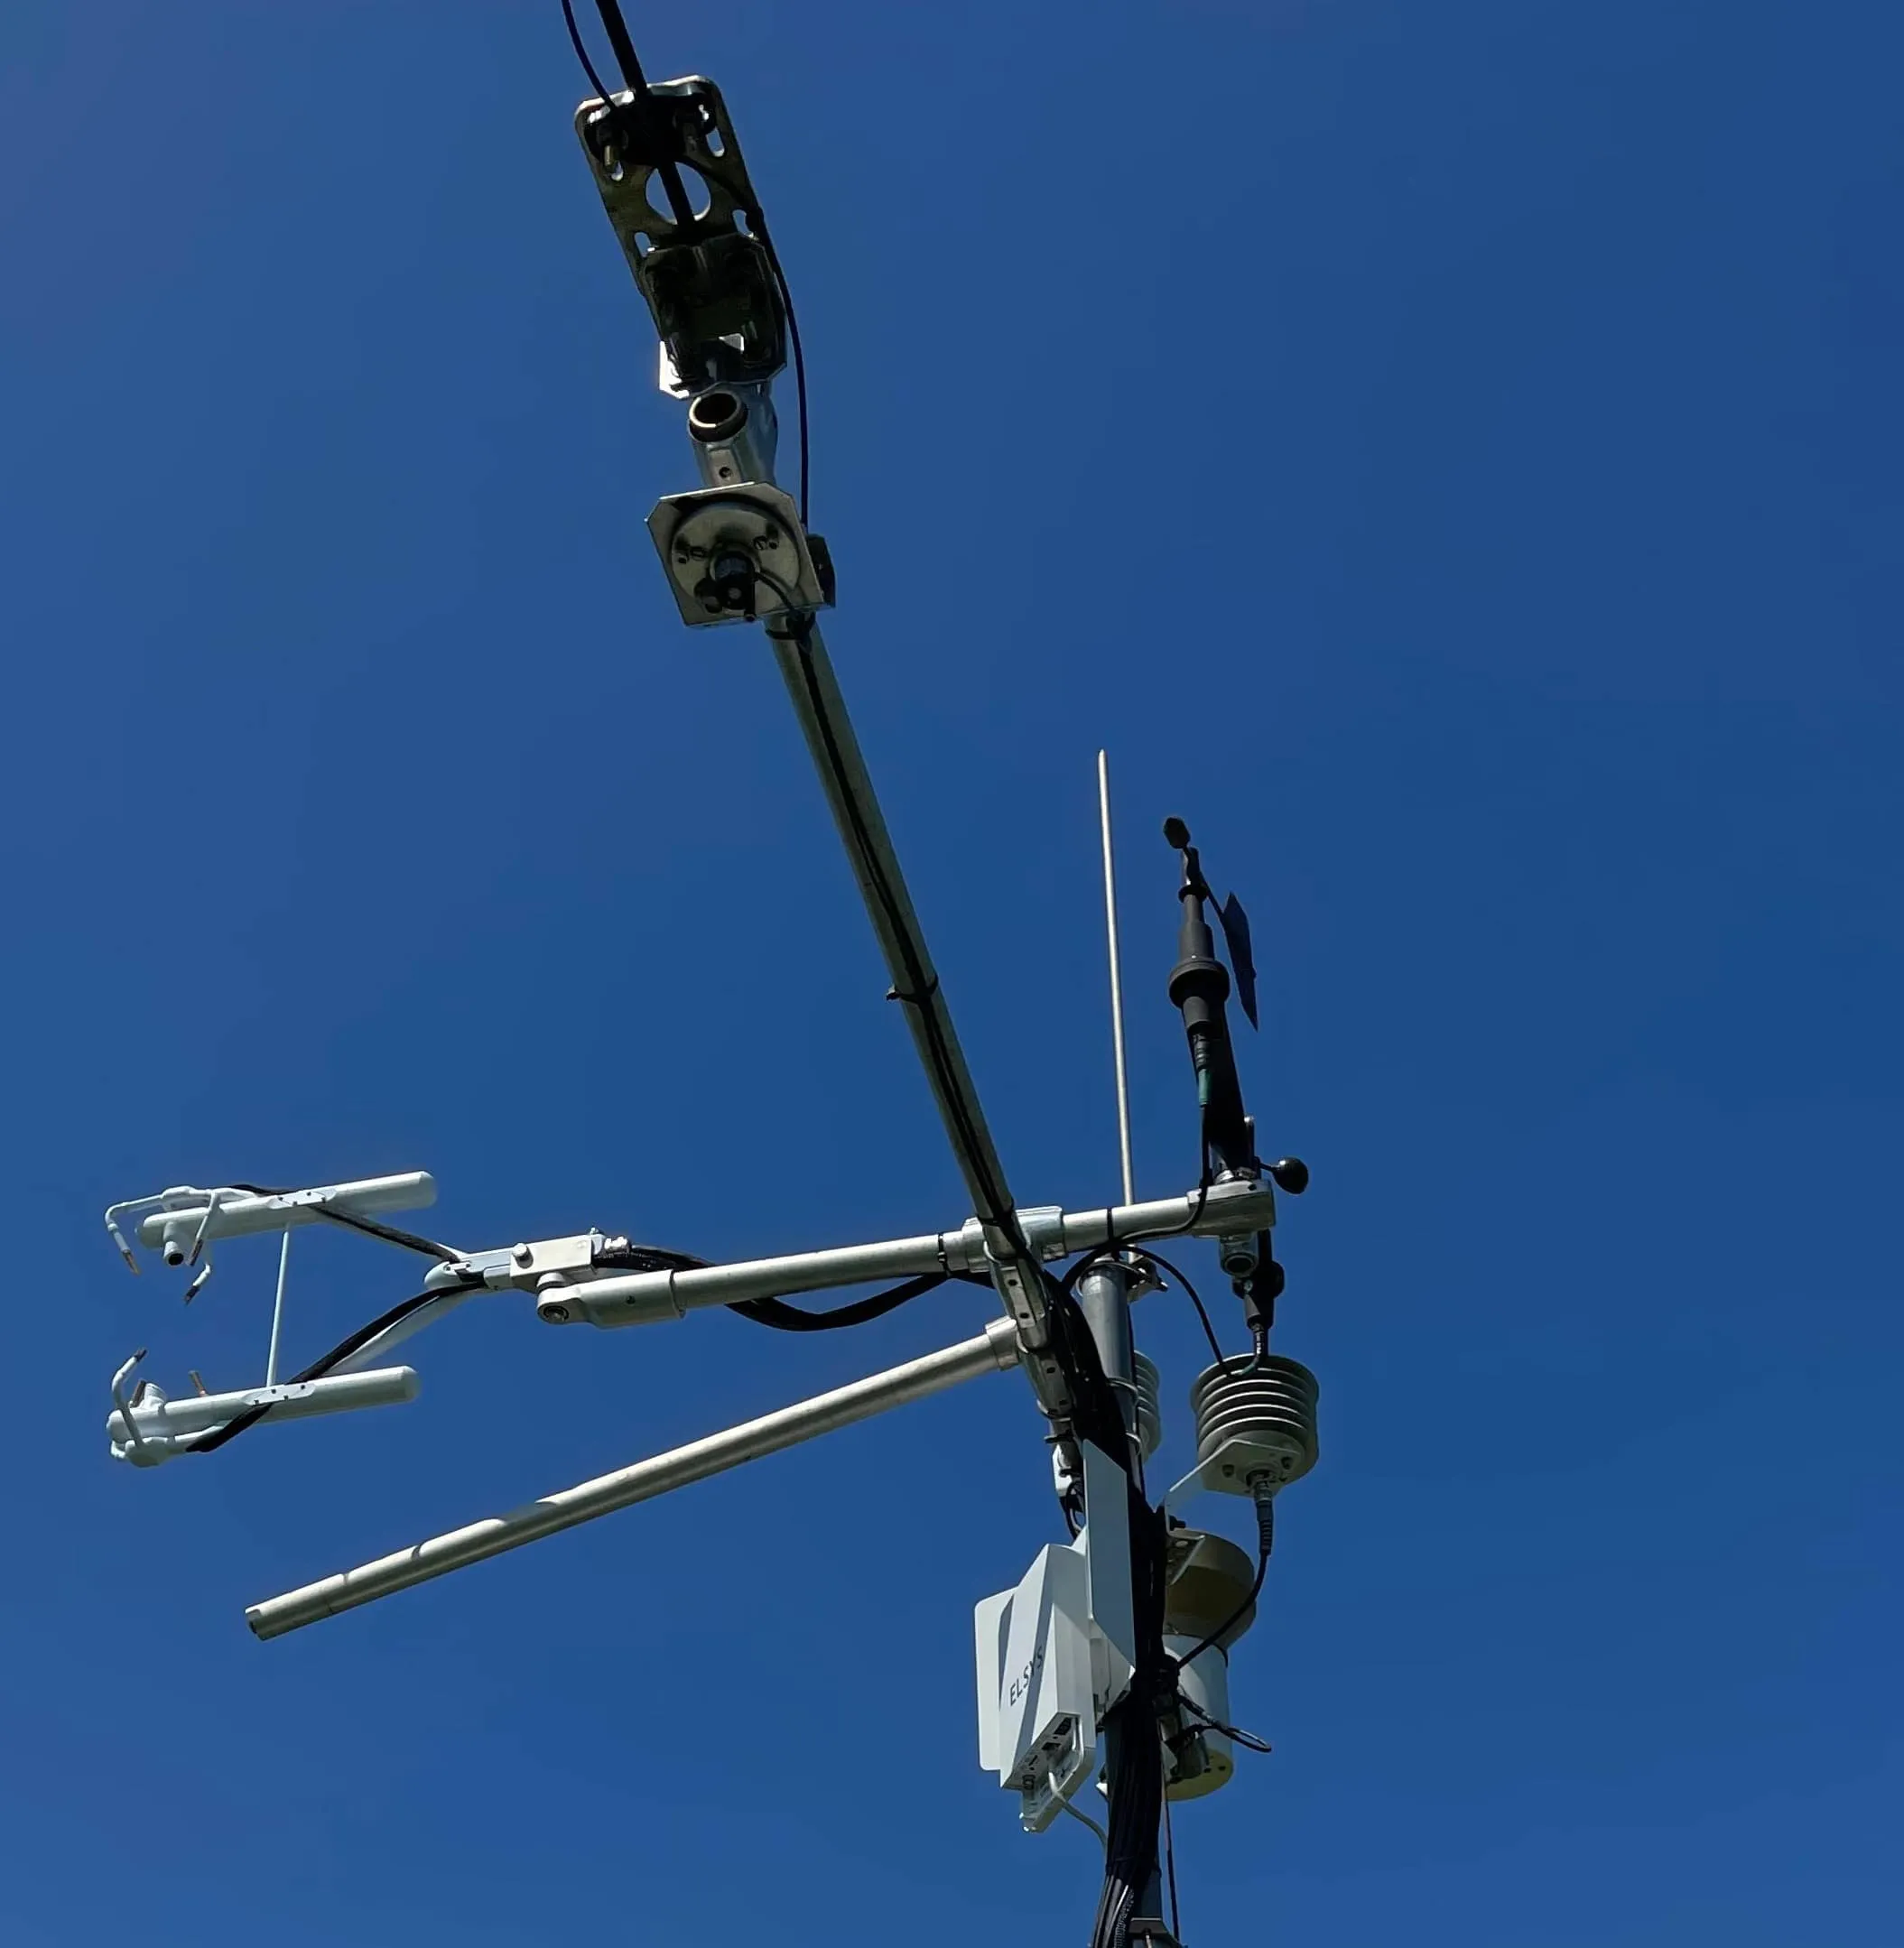
We install and commission the tower on your land: sonic anemometer, gas analyser, and radiation and soil sensors. It operates autonomously and transmits data continuously.
The high-frequency readings undergo quality control and are processed into fluxes — how much carbon the area absorbed and how much it emitted, under your management.
The tower becomes the reference for models driven by satellite imagery, extending the result to the rest of the property or to the region.
Because the tower integrates the entire field around it rather than a few sampling points, the result describes the area an auditor, a buyer or an agronomist is actually asking about.
Services
We measure in the field, model the areas without instrumentation, and deliver both in a form that holds up in reports and audits.
We install and operate the systems that continuously record the greenhouse gas absorption and emission of your area. This is the primary data on which carbon credit projects and product claims are built.
Factors obtained on your own land, under Brazilian conditions, instead of default values from the United States or Europe. Carbon accounting then reflects your production system.
With satellite imagery and modelling, we extend the tower result to the whole property or region, with the validation needed to support the number.
Continuous measurement of crop water consumption to guide irrigation: less water pumped, lower energy use and yield preserved.
mm day⁻¹
Measured water consumption
30 min
Interval between readings
Water
Our towers measure water use directly and in real time — the water evaporating from the soil plus the water released by the plants. It is the actual consumption of the area, recorded continuously rather than estimated from a reference equation.
Combined with soil moisture sensors and weather forecasts, irrigation becomes a decision based on measurement: less water pumped, lower energy consumption and soil moisture held within the range the crop requires.
Modelling
The tower delivers a reliable answer for the area around it. For everywhere else, we develop a model calibrated against those measurements and driven by information available anywhere: satellite imagery showing the condition of the vegetation, and weather data. The tower remains the reference; the model extends that answer across the region.
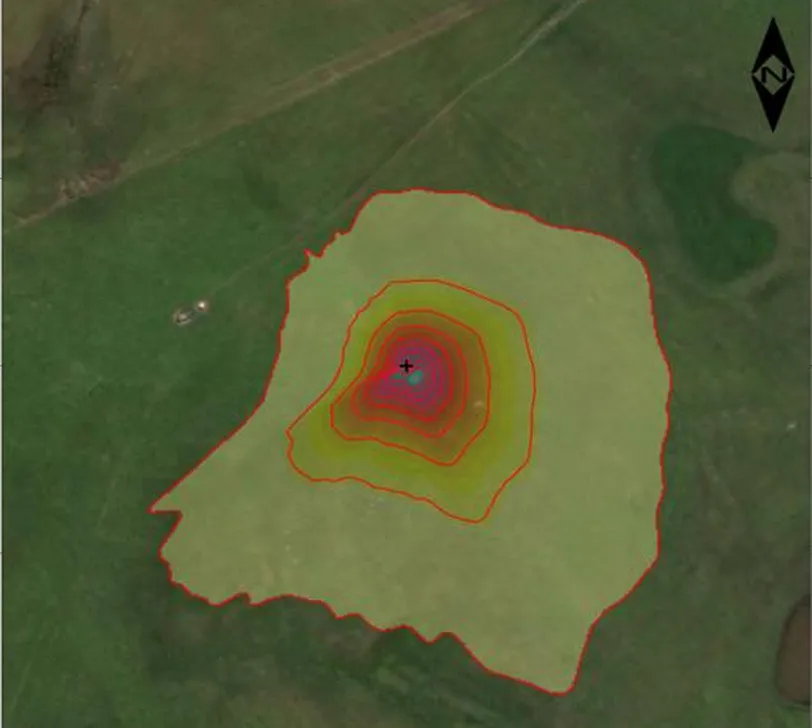
The model is adjusted until it reproduces the carbon measured by the tower from weather and vegetation conditions alone.
An entire site is withheld from training and then predicted without the model ever having seen it. This is how we verify that it works where no measurement exists.
Applied to satellite and weather data across a region, the model estimates the carbon balance where there is no tower — the whole property, the region, or the sourcing area.
The model was developed from years of field measurement and improves continuously: every tower we install adds data and increases the accuracy of the estimates across the surrounding region.
About us
fluxGHG exists to replace assumed figures with measured ones in Brazilian agriculture.
Team
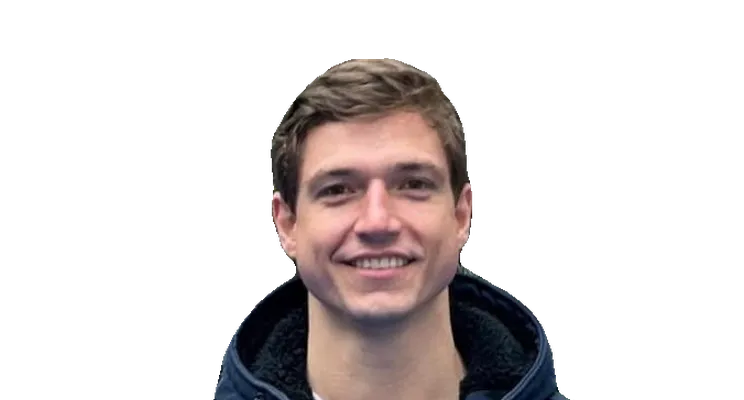
Co-founder & CEO
Ph.D. candidate in Physics with long experience installing and setting up eddy covariance systems. Alecsander understands in depth how gas measurement in the field works, and leads monitoring and model development at the company.
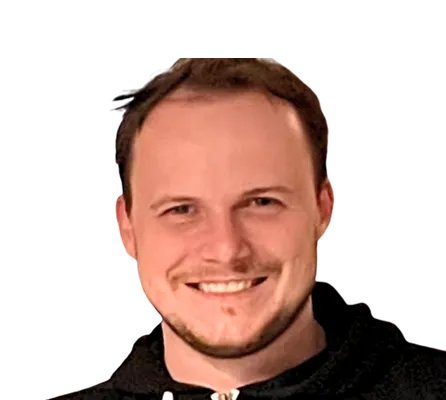
Co-founder & CTO
Electrical Engineer specialising in data processing and analysis. Josué builds the technology behind fluxGHG — the systems and models that turn raw readings into data you can rely on.
Contact
Whether you need a carbon balance for a certification, numbers for an inventory, or water data to irrigate better — write to us and we will get back to you shortly.